
15 Nov 2023
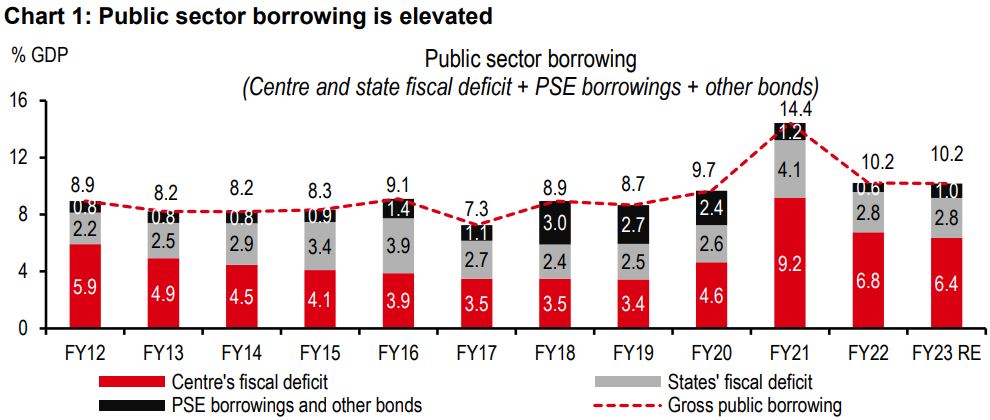
India’s fiscal finances are in better shape today than in the past in terms of quality of spend. But a lot more needs to be done on fiscal consolidation. After all, public sector gross borrowing is in double-digits.
Let’s start with the current year. There are several pressures, for instance high capex growth in 1H and pre-election spending needs. But, the surprisingly high direct tax collection, and some cut back in capex in 2H could help achieve the 5.9% central fiscal deficit target. Alongsidethis, the spending quality of states has improved markedly this year. Sounds good, so what’s the problem?
GDP growth seems to be back at pre-pandemic levels of 6.5% but the fiscal deficit remains much higher (see chart 1). The need to lower the deficit is well known. India runs public debt, deficit and interest bill ratios that are higher than the world average, despite growth being strong. More importantly, even though bank investment in g-secs has fallen, non-bank investment has risen by a similar clip. This substantial quantum of investment in g-secs may become more obvious when funds to start a new private sector capex cycle are needed. What’scaused the excesses?
We find that compared with the last pre-pandemic ‘normal’ year (FY19), the centralfiscal deficitis higher (by 2.5% of GDP) and, while the capex budget is encouragingly bigger now (by 1.1% of GDP), current expenditure is even higher (by 2.1% of GDP). Meanwhile, the state fiscal deficit is only 0.3% higher over this period. Thus, for now, the centre may have to play a bigger role in getting back to pre-pandemic levels.
How does the central government go about lowering the deficit from 5.9% of GDP (FY24 Budget Estimates (BE)) to 3.4% of GDP (in FY19)? Can gross taxes be raised? Falling commodity prices have boosted corporate profitability and direct taxes, but can’t be reliedupon indefinitely. Can net taxes be raised? Transfers to states have fallen already and can’t be relied upon for more consolidation. Can privatisation receipts be raised? For sure, but there have been misses in the past. Can the subsidy bill be cut? Yes, but recent trends show an increase in both price and income support. Can other expenditure be cut? Yes, but centrally-sponsored schemes are on the rise, and may not be cut immediately. So what could be a sure shot way for the needed fiscal consolidation? We believe strong GDP growth is important. In recent history, India consolidated most in periods of high growth (i.e. 7%). And, of course, a strong commitment for consolidation will be critical.
The number of questions we get asked on India’s fiscal finances have clearly fallen in number, and that’s a good thing. There is a perception that India’s fiscal finances, while having worsened in the pandemic period, aremore under control now compared withthe past.
And there is merit to this positive perception. After rising sharply in the pandemic period, the central government’s fiscal deficit has fallen each year since (from 9.2% of GDP in FY21 to 6.4% in FY23), and is likely to fall further, given the government’s various targets(e.g. under 4.5% by FY26). Gross tax revenue growth so far this year has been strong, in fact stronger than widely expected (growing 16.3% y-o-y ytd versus budget estimate of 10.1% y-o-y for the full year).
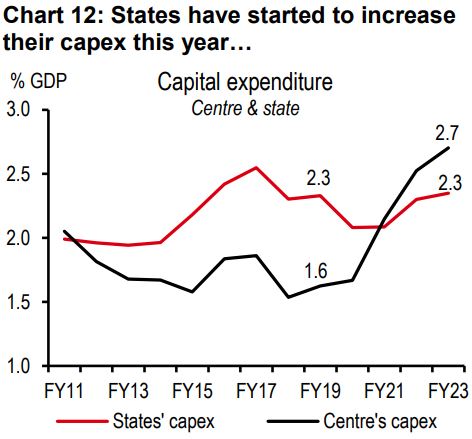
The quality of spending has improved through the pandemic period. Capital spending by the central government has risen appreciably (from 1.6% of GDP in FY19 to 2.7% in FY23). And this has followed on the heels of the centralgovernment’s efforts to make the fiscal accounts cleaner and more transparentby moving the below-the-line expenses above the line.
At the same time, we notethe states’ fiscal deficit is also broadly in line with pre-pandemic levels (of 2.5-3% of GDP).
And yet, some worries remain. Public sector borrowing is in double digits (seechart 1). Much of the planned fiscal consolidation of the central government is pending (from 6.4% of GDP in FY23 to the 4.5% target in FY26, and eventually to the long-standing Finance Commission target of 3%). Past experience shows that consolidation gets harder in the outer years, as tough decisions need to be made. For instance, should capex be cut in order to lower the fiscal deficit?
Some spending commitments have risen. For instance, the extension of the free food scheme for thenext fiveyears could cost the exchequer about INR150bn per year in the form of revenue foregone. And the cost of running the scheme will likely only rise from here, in line with higher food grain procurement costs, for example led by a rise in MSPs1.
Furthermore, as we discuss later, the number of centrally sponsored schemes have also been on the rise, where the central government puts up the initial outlay and the state governments add to it and implement the programme.
Will it be easy to consolidate the fiscal deficit from here while preserving the much-improved quality? We answer some key questions on this front.
Let’s start with the current year. Earlier in the year, the central government announced a fiscal deficit target of 5.9% of GDP for FY24 (from 6.4% in FY23). But pressures have mounted since.
One, commodity prices have fallen and, led by a sharply lower deflator, nominal GDP growth may come in much lower than forecast (8.7% HSBC vs 10.5% BE).
Two, it doesn’t help that this is a pre-election year when pressure on current expenditure traditionally tend to mount. Current expenditure grew by 10% y-o-y in 1H versus a full year target of 1.4%.
Three, capital expenditure has risen rapidly (by 43% y-o-y in 1H versus a full year target of 36%), led in particular by interest-free long-term loans to states.
And yet, we believe the fiscal deficit target will broadly be met (see table 1). Gross tax revenues have been rising much faster than expected (16.3% y-o-y ytd versus 10.1% budgeted for the full year).
The fall in commodity prices, which lowered nominal GDP growth making fiscal consolidation harder, is also lowering the cost of production of firms, leading to better profitability and tax revenue growth. No wonderthat direct taxes are growing more impressively (25.4% y-o-y ytd versus 11.6% budgeted for the full year) than indirect taxes (6.6% y-o-y ytd versus 8.3% budgeted for the full year).
But for the challenging 5.9% fiscal deficit target to be met, capex will have to be lowered sharply in 2H. In fact, we believe the central government may have encouraged a larger-than-normal push to capex in 1H (see chart 2), so it can focus on other election priorities in 2H.
We believe that the overall capex will come in around INR8.1tr in FY24, much higher than in FY2023 (INR7.4tr), but a shade lower than the INR10tr target. And of this, 60% has already been spent in 1H2.


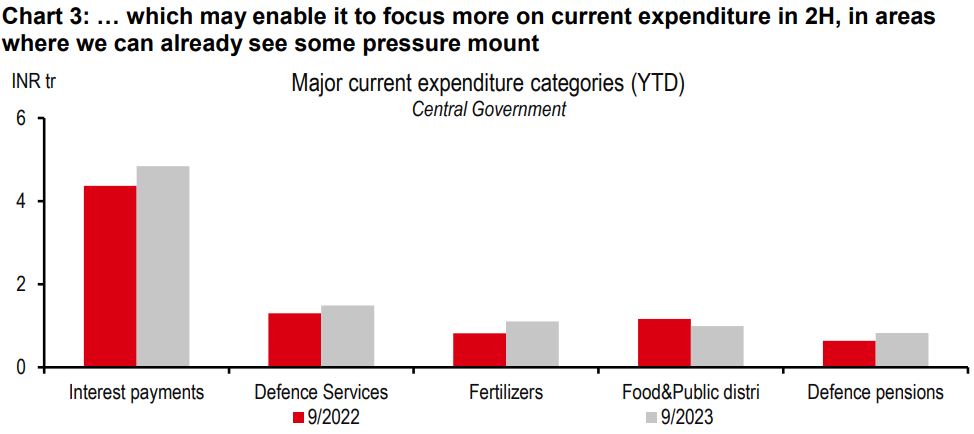
Current expenditure has risen sharply (10% y-o-y ytd versus 1.4% budgeted for the full year, see chart 3), and the space for it to rise at an even faster clip in 2H will not be there, unless capex is slashed even more than we anticipate, or the fiscal deficit target is relaxed3.
And then there are the states. Following a ‘spending strike’ last year, the states have raised spending in FY24 and could post a fiscal deficit of closer to 3% of GDP from 2.8% in FY23. But we are not too worried. Much of their spend has been capex focused so far, and they are normally bound by the 3% fiscal deficit rule and cannot borrow from the market if the deficit crosses 3% (unless it is a special case, for instance, higher borrowing allowed during the pandemic if the states did certain reforms).
All said, with some good luck (falling commodity prices) and hard work (keepinga tighter rein on expenditure in 2H), we believe the centre’s FY24 fiscal deficit target could just about be met. Meanwhile, the states have ramped up on ‘good’ quality spend.
But does that mean India doesn’t have a fiscal problem? Even if the current year’s fiscal deficit comes in lower than the previous year, is that good enough? How much more does the deficit need to be lowered in order to become sustainable, and how do we get there?
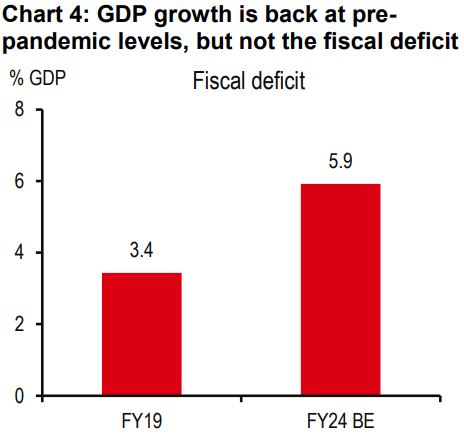
India’s GDP growth has been robust, if we look at PMI domestic orders and tax collection. GDP growth is forecast at 6.5% for the current year (FY24) by the RBI, which is exactly where it was in the last ‘normal’ year before the pandemic (i.e. FY19). This begs the question that if GDP growth is back at pre-pandemic levels, why is the central government fiscal deficit much higher (see chart 4).
The question that follows is why does the fiscal deficit even have to fall down? We address this in the followingsection.
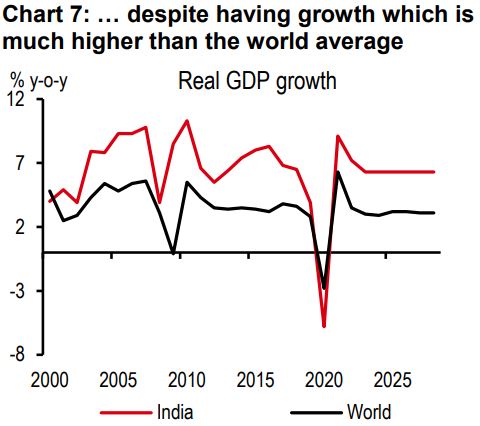
India stands out on the global stage for its high debt and deficit (see charts 5 and 6). And this is despite having annual growth which is much higher than the world average (see chart 7).

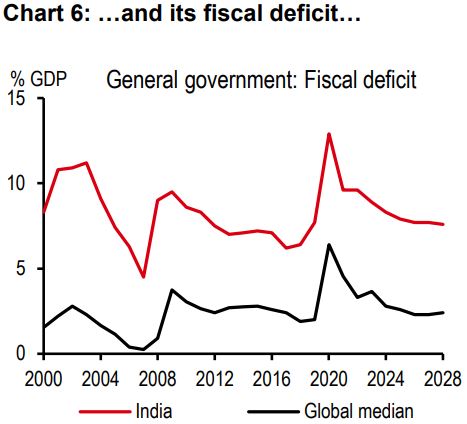


What stands out most is India’s interest bill, which is not just higher than the world average, but also exhausts 45-50% of the net tax revenues (see charts 8 and 9). And while India’s government debt is much lower than the advanced economies’ debt, its interest servicing cost is far higher than the advanced economies, making the elevated debt a problem.
It is worth highlighting that after years of careful effort, the Statutory Liquidity Ratio has been cut (from 24% in the early 2000s to 18% now), and the bank holding of government bonds has fallen. This is useful because more resources are available for funding the private sector.
But this is just part of the story. Household savings have been rising for non-bank categories like insurance and pension funds (see chart 10), and the bulk of their savings are going into funding the fiscal deficit. In other words, where banks are cutting back on investing in government bonds, non-banks are raising their investment. Looking at banks and non-banks together, no morefunds are becoming available for the private sector (see chart 11). For more funds to become available, the fiscal deficit and thereby market borrowing needs to fall.
This may not seem to be a pressing issue right now, but could become important when theprivate sector capex cycle rises and demands the funding.
Was it the states leading the fiscal excesses? We look at state finances, and interestingly their deficit hasn’t widened very much since the pandemic (see table 2). Their revenues fell sharply, but they cut expenditure and thereby limited the fiscal slippage, at least until last year (FY23).
In fact, some effort had to be made to end the states’ ‘spending strike’ earlier this year. With the help of the centre’s capex loans to states (budgeted at INR1.3tn for FY24), and upfront finance commission tax revenue transfers to states, states have started to increase capex this year (see chart 12) and their overall expenditure growth, which was well below nominal GDP growth last year, has moved above those levels this year (seechart 13).
The challenge for the states from here is to ensure that they stick to good quality spending amid controlled fiscal borrowing.
So if it’s not the states leading the fiscal excesses sincethe pandemic, it must be the centre. To understand better, we compare the centre’s finances in FY24 (HSBC forecast) with FY19, the last ‘normal’ year before the pandemic.
What we find is rather unexpected. While the capex bill has risen by 1.1% of GDP, current expenditure has increased by almost double that during that period (see charts 14 and 15). And perhaps, the drive for fiscal consolidation should be focused there.


First off, what does the central fiscal deficit needto be lowered to? There are three different targets depending on the horizon. First, the Finance Ministryhas a 5.9% of GDP target for FY24 (from 6.4% in FY23). Second,it has a FY26 target ofunder 4.5% of GDP. Third, thefinance commission has a medium-term target of3%of GDP.
What we prefer instead, as ausefulgoal, is to get the fiscal deficit back to the last normal pre-pandemic year’s level of 3.4% of GDP (this was where it was in FY19). This would mean an almost 2.5% of GDP consolidation from FY24 levels (see table 3).
How do we go about lowering the central government fiscal deficit without cutting back on capex?
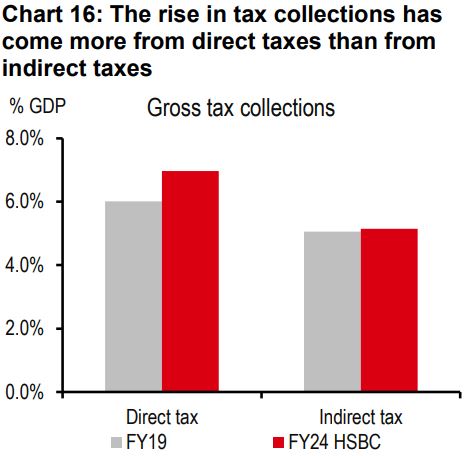
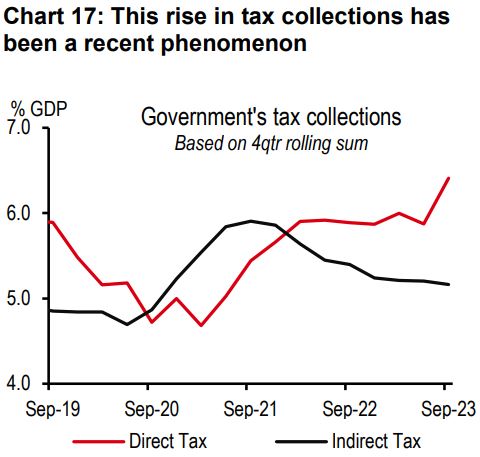
1. Can central government gross taxes be raised? Tax buoyancy has risen between FY19 and FY24 (ytd), but the drivers of this rise may not continue to yield year after year. A closer look suggests that the rise has come from direct taxes (see chart 16), not indirect taxes. And this rise has come primarily over the last few quarters (see chart 17). We believe a lot has to do with commodity prices falling, lowering production costs and raising profits of the corporates. But this boost may not last. For instance, oil prices fell 40% in the March quarter and 14% in the June quarter, and fell 3% in October. As such, higher taxes can’t be the only tool for consolidation.
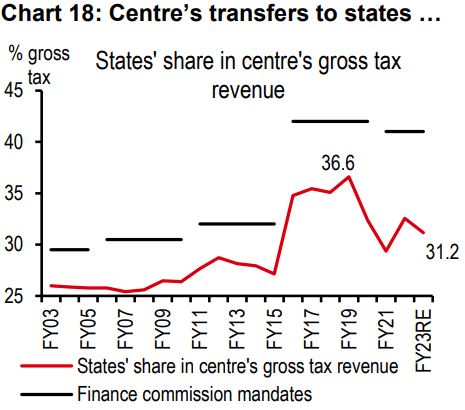
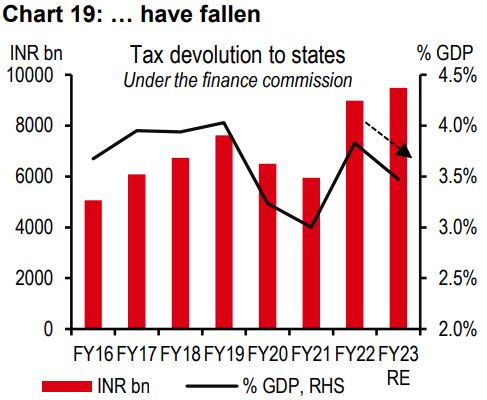
2. Can central government net taxes be raised? Tax devolution to the states has already fallen, leaving limited room for a further fall (see charts18 and 19).
3. Can disinvestment receipts be raised? Disinvestment receipts have disappointed over the last several years (see chart 20). True, the Air India disinvestment (which was completed in January 2022) was notable, but barring that, disinvestments havebeen slower than budgeted.
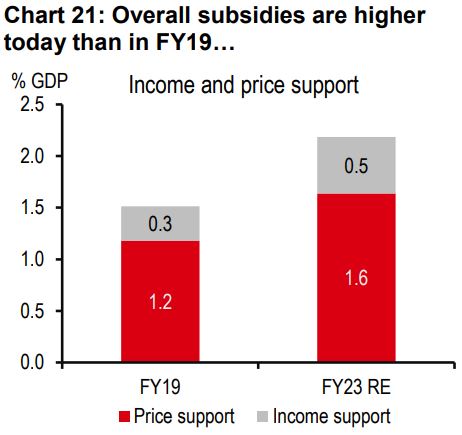
4. Can the subsidy bill be cut? India traditionally provided price subsidies for food, fertiliser and oil (e.g. kerosene oil). In more recent years, it ventured into direct cash transfers (e.g. PM Kisan) but the income support was added on tothe price support. It did not replace price support. Across the various definitions, overall subsidies are higher today than in FY19 (see charts 21 and 22). And steps such as the extension of the free food scheme for the next five years do not give a sense than the bill will be bought down rapidly.
5. Can ‘other current expenditure’ be cut? Current expenditure is not just about subsidies. There are many centrally-sponsored schemes that the central government runs, in which it gives some upfront funding (about 60%). States provide the remaining funding (of about 40%) and implement the scheme.After a careful process of lowering the number of schemes, these have been raised again in recent years. In fact, the central government has recently made a rule that if the states do not spend the money quickly, they will have to pay an interest cost to the centre on the unspent amount4. So if these schemes are being raised and encouraged, it seems unlikely that cutting back on them will be a tool for fiscal consolidation.


So, if going by recent experience, neither higher gross/net taxes and other receipts, nor subsidy and other current spending cuts can be relied upon for fiscal consolidation, what can?
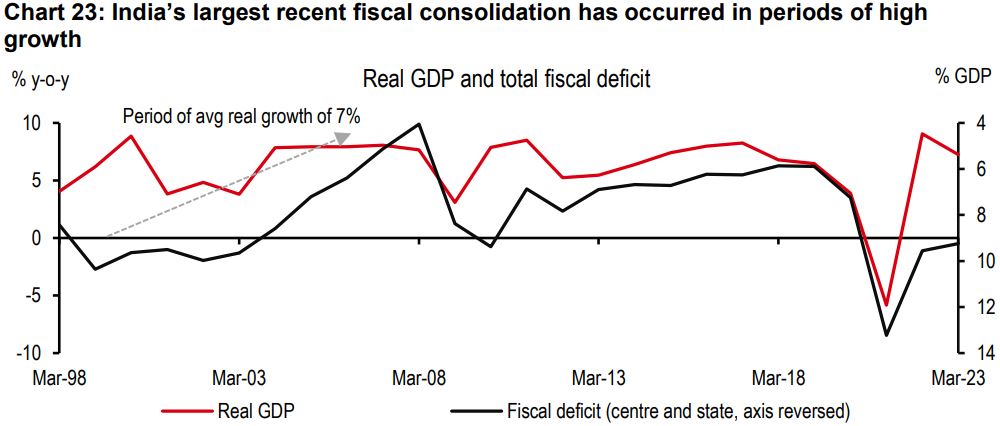
Going back into the history shows that one of India’s best periods of fiscal consolidation was between 2001 (FY02) and 2007 (FY08) (see chart 23). That is also the period when growth averaged a strong 7%. Higher GDP growth helps raise tax revenues faster, while pressure on expenditure doesn’t rise at the same clip.
We believe that India will grow faster in the next decade than it grew in the previous decade. On the back of the new high-tech sectors which have sprung up in recent years, we expect GDP to grow at 6.5%paover the next decade, compared to 6% at the eve of the pandemic.
Can India grow faster, at around 7%, as inthe early days of the 2000s? We believe that would be difficult, especially given the current global backdrop, but not impossible. If new India (comprising hi-tech goods and services manufacturing, and techstart-ups plugged into the digital public infrastructure) can energise oldIndia (agriculture and low-and medium-tech manufacturing) via innovations such as fin-tech (enabling small firms to access to credit) e-commerce (helping small firms to access to cheaper raw materials and new markets), and agri-tech, a growth clip of 7.5% is possible. But reforms, for instance in thepower sector, direct taxes, skilling and education, will also have to keep pace.
Alongside high growth, a strong political commitment to lower the fiscal deficit will be equally, if not more, important. For instance, most of the five points discussed above need the support of the political economy.
India has made some important strides in improving the quality of spend. But the fiscal deficit must be lowered further to support the funding for a new private sector capex cycle. And both strong GDP growth and political intent will be important for that.


Important disclosures
Additional disclosures
1. This report is dated as at 15 November 2023.
2. All market data included in this report are dated as at close 13 November 2023, unless a different date and/or a specific time of day is indicated in the report.
3. HSBC has procedures in place to identify and manage any potential conflicts of interest that arise in connection with its Research business. HSBC's analysts and its other staff who are involved in the preparation and dissemination of Research operate and have a management reporting line independent of HSBC's Investment Banking business. Information Barrier procedures are in place between the Investment Banking, Principal Trading, and Research businesses toensure that any confidential and/or price sensitive information is handled in an appropriate manner.
4. You are not permitted to use, for reference, any data in this document for the purpose of (i) determining the interest payable, or other sums due, under loan agreements or under other financial contracts or instruments, (ii) determining the price at which a financial instrument may be bought or sold or traded or redeemed, or the value of a financial instrument, and/or (iii) measuring the performance of afinancial instrument or of an investment fund.
This document or video is prepared by The Hongkong and Shanghai Banking Corporation Limited (‘HBAP’), 1 Queen’s Road Central, Hong Kong. HBAP is incorporated in Hong Kong and is part of the HSBC Group. This document or video is distributed and/or made available, HSBC Bank (China) Company Limited, HSBC Bank (Singapore) Limited, HSBC Bank Middle East Limited (UAE), HSBC UK Bank Plc, HSBC Bank Malaysia Berhad (198401015221 (127776-V))/HSBC Amanah Malaysia Berhad (20080100642 1 (807705-X)), HSBC Bank (Taiwan) Limited, HSBC Bank plc, Jersey Branch, HSBC Bank plc, Guernsey Branch, HSBC Bank plc in the Isle of Man, HSBC Continental Europe, Greece, The Hongkong and Shanghai Banking Corporation Limited, India (HSBC India), HSBC Bank (Vietnam) Limited, PT Bank HSBC Indonesia (HBID), HSBC Bank (Uruguay) S.A. (HSBC Uruguay is authorised and oversought by Banco Central del Uruguay), HBAP Sri Lanka Branch, The Hongkong and Shanghai Banking Corporation Limited – Philippine Branch, HSBC Investment and Insurance Brokerage, Philippines Inc, and HSBC FinTech Services (Shanghai) Company Limited and HSBC Mexico, S.A. Multiple Banking Institution HSBC Financial Group (collectively, the “Distributors”) to their respective clients. This document or video is for general circulation and information purposes only.
The contents of this document or video may not be reproduced or further distributed to any person or entity, whether in whole or in part, for any purpose. This document or video must not be distributed in any jurisdiction where its distribution is unlawful. All non-authorised reproduction or use of this document or video will be the responsibility of the user and may lead to legal proceedings. The material contained in this document or video is for general information purposes only and does not constitute investment research or advice or a recommendation to buy or sell investments. Some of the statements contained in this document or video may be considered forward looking statements which provide current expectations or forecasts of future events. Such forward looking statements are not guarantees of future performance or events and involve risks and uncertainties. Actual results may differ materially from those described in such forward-looking statements as a result of various factors. HBAP and the Distributors do not undertake any obligation to update the forward-looking statements contained herein, or to update the reasons why actual results could differ from those projected in the forward-looking statements. This document or video has no contractual value and is not by any means intended as a solicitation, nor a recommendation for the purchase or sale of any financial instrument in any jurisdiction in which such an offer is not lawful. The views and opinions expressed are based on the HSBC Global Investment Committee at the time of preparation and are subject to change at any time. These views may not necessarily indicate HSBC Asset Management‘s current portfolios’ composition. Individual portfolios managed by HSBC Asset Management primarily reflect individual clients’ objectives, risk preferences, time horizon, and market liquidity.
The value of investments and the income from them can go down as well as up and investors may not get back the amount originally invested. Past performance contained in this document or video is not a reliable indicator of future performance whilst any forecasts, projections and simulations contained herein should not be relied upon as an indication of future results. Where overseas investments are held the rate of currency exchange may cause the value of such investments to go down as well as up. Investments in emerging markets are by their nature higher risk and potentially more volatile than those inherent in some established markets. Economies in emerging markets generally are heavily dependent upon international trade and, accordingly, have been and may continue to be affected adversely by trade barriers, exchange controls, managed adjustments in relative currency values and other protectionist measures imposed or negotiated by the countries with which they trade. These economies also have been and may continue to be affected adversely by economic conditions in the countries in which they trade. Investments are subject to market risks, read all investment related documents carefully.
This document or video provides a high-level overview of the recent economic environment and has been prepared for information purposes only. The views presented are those of HBAP and are based on HBAP’s global views and may not necessarily align with the Distributors’ local views. It has not been prepared in accordance with legal requirements designed to promote the independence of investment research and is not subject to any prohibition on dealing ahead of its dissemination. It is not intended to provide and should not be relied on for accounting, legal or tax advice. Before you make any investment decision, you may wish to consult an independent financial adviser. In the event that you choose not to seek advice from a financial adviser, you should carefully consider whether the investment product is suitable for you. You are advised to obtain appropriate professional advice where necessary.
The accuracy and/or completeness of any third-party information obtained from sources which we believe to be reliable might have not been independently verified, hence Customer must seek from several sources prior to making investment decision.
The following statement is only applicable to HSBC Mexico, S.A. Multiple Banking Institution HSBC Financial Group with regard to how the publication is distributed to its customers: This publication is distributed by Wealth Insights of HSBC México, and its objective is for informational purposes only and should not be interpreted as an offer or invitation to buy or sell any security related to financial instruments, investments or other financial product. This communication is not intended to contain an exhaustive description of the considerations that may be important in making a decision to make any change and/or modification to any product, and what is contained or reflected in this report does not constitute, and is not intended to constitute, nor should it be construed as advice, investment advice or a recommendation, offer or solicitation to buy or sell any service, product, security, merchandise, currency or any other asset.
Receiving parties should not consider this document as a substitute for their own judgment. The past performance of the securities or financial instruments mentioned herein is not necessarily indicative of future results. All information, as well as prices indicated, are subject to change without prior notice; Wealth Insights of HSBC Mexico is not obliged to update or keep it current or to give any notification in the event that the information presented here undergoes any update or change. The securities and investment products described herein may not be suitable for sale in all jurisdictions or may not be suitable for some categories of investors.
The information contained in this communication is derived from a variety of sources deemed reliable; however, its accuracy or completeness cannot be guaranteed. HSBC México will not be responsible for any loss or damage of any kind that may arise from transmission errors, inaccuracies, omissions, changes in market factors or conditions, or any other circumstance beyond the control of HSBC. Different HSBC legal entities may carry out distribution of Wealth Insights internationally in accordance with local regulatory requirements.
Important Information about the Hongkong and Shanghai Banking Corporation Limited, India (“HSBC India”)
HSBC India is a branch of The Hongkong and Shanghai Banking Corporation Limited. HSBC India is a distributor of mutual funds and referrer of investment products from third party entities registered and regulated in India. HSBC India does not distribute investment products to those persons who are either the citizens or residents of United States of America (USA), Canada, Australia or New Zealand or any other jurisdiction where such distribution would be contrary to law or regulation.
The following statement is only applicable to HSBC Bank (Taiwan) Limited with regard to how the publication is distributed to its customers: HSBC Bank (Taiwan) Limited (“the Bank”) shall fulfill the fiduciary duty act as a reasonable person once in exercising offering/conducting ordinary care in offering trust services/ business. However, the Bank disclaims any guarantee on the management or operation performance of the trust business.
The following statement is only applicable to PT Bank HSBC Indonesia (“HBID”): PT Bank HSBC Indonesia (“HBID”) is licensed and supervised by Indonesia Financial Services Authority (“OJK”). Customer must understand that historical performance does not guarantee future performance. Investment product that are offered in HBID is third party products, HBID is a selling agent for third party product such as Mutual Fund and Bonds. HBID and HSBC Group (HSBC Holdings Plc and its subsidiaries and associates company or any of its branches) does not guarantee the underlying investment, principal or return on customer investment. Investment in Mutual Funds and Bonds is not covered by the deposit insurance program of the Indonesian Deposit Insurance Corporation (LPS).
Important information on ESG and sustainable investing
In broad terms “ESG and sustainable investing” products include investment approaches or instruments which consider environmental, social, governance and/or other sustainability factors to varying degrees. Certain instruments we classify as sustainable may be in the process of changing to deliver sustainability outcomes. There is no guarantee that ESG and Sustainable investing products will produce returns similar to those which don’t consider these factors. ESG and Sustainable investing products may diverge from traditional market benchmarks. In addition, there is no standard definition of, or measurement criteria for, ESG and Sustainable investing or the impact of ESG and Sustainable investing products. ESG and Sustainable investing and related impact measurement criteria are (a) highly subjective and (b) may vary significantly across and within sectors.
HSBC may rely on measurement criteria devised and reported by third party providers or issuers. HSBC does not always conduct its own specific due diligence in relation to measurement criteria. There is no guarantee: (a) that the nature of the ESG / sustainability impact or measurement criteria of an investment will be aligned with any particular investor’s sustainability goals; or (b) that the stated level or target level of ESG / sustainability impact will be achieved. ESG and Sustainable investing is an evolving area and new regulations are being developed which will affect how investments can be categorised or labelled. An investment which is considered to fulfil sustainable criteria today may not meet those criteria at some point in the future.
THE CONTENTS OF THIS DOCUMENT OR VIDEO HAVE NOT BEEN REVIEWED BY ANY REGULATORY AUTHORITY IN HONG KONG OR ANY OTHER JURISDICTION. YOU ARE ADVISED TO EXERCISE CAUTION IN RELATION TO THE INVESTMENT AND THIS DOCUMENT OR VIDEO. IF YOU ARE IN DOUBT ABOUT ANY OF THE CONTENTS OF THIS DOCUMENT OR VIDEO, YOU SHOULD OBTAIN INDEPENDENT PROFESSIONAL ADVICE.
© Copyright 2024. The Hongkong and Shanghai Banking Corporation Limited, ALL RIGHTS RESERVED.
No part of this document or video may be reproduced, stored in a retrieval system, or transmitted, on any form or by any means, electronic, mechanical, photocopying, recording or otherwise, without the prior written permission of The Hongkong and Shanghai Banking Corporation Limited.

