
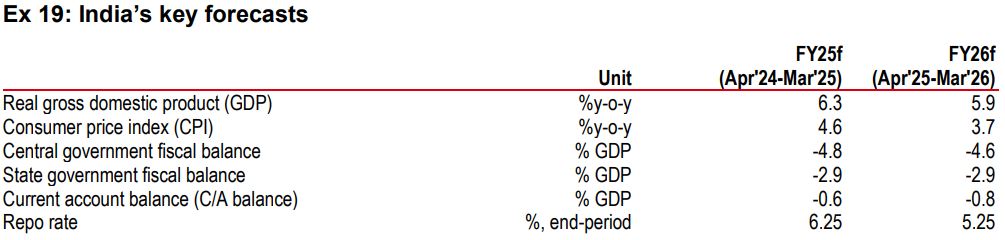
23 May 2025
There is a general sense that India is mostly a domestic demand-driven economy. We disagree. We find that India has grown at its fastest pace in periods of rising global integration with the world. We use the rolling correlation between India and world GDPgrowth as a measure of global integration, and find that the 2000-2010 decade was a period of falling import tariffs, as well as rising global integration, export share, and GDP growth. In the next decade, 2010-2020, all of this changed. Tariffs were raised, and global integration, export share and GDP growth fell. Encouragingly, the few years following the pandemic reflect a rise in global integration once again, though so far it remains slightly one-sided –more financial integration, less trade integration.
We drill down into GDP sectors and find that consumption is most integrated with world growth (95%), followed by investment (70%), and then exports (35%). Surprising, as one might imagine exports to be most globally aligned. One reason could be that India’s global connections are stronger in finance (Indian equity markets have become far more aligned with global equities over the last two decades), and this impacts consumption. But integration remains weaker in trade, which influences export and investment.
Within investment, we find corporate investment is more globally integrated, something we notice across countries. Meanwhile, integration is lower for household investment, which includes both real estate and investment by small firms. Within consumption, discretionary consumption is more globally interlinked than essentials. If indeed financial integration has been strong, it is likely to support high-end consumers who tend to be better invested in financial markets. Within exports, weak integration has been led by more labour-intensive mid-tech exports (like textiles and toys), which have been sluggish for a decade. Bringing all sectors together, we have two distinct stories unfolding.
Stronger financial integration: Those who have been able to enjoy the gains of financial integration, have seen incomes and discretionary consumption rise. Many of these individuals are associated with large firms (where global capex is globally correlated) or new sectors (e.g. rapidly rising professional services exports). Weaker trade integration: On the other hand, lower global integration in mid-tech exports explains weaker growth and incomes, and why individuals in these sectors are largely focused on consumption of essentials, without much surplus for investment. A corollary here would be that steps which raise mid-tech labour-intensive exports can boost India’s trade interlinkages, mass consumption, investment, and India’s GDP growth. An opportunity to grow exports as supply chains are getting redrawn is knocking at the door.
There is a general sense that India is a relatively inward-looking economy. After all, agriculture makes up c18% of GDP and depends more on weather patterns than international demand. And India is more domestic demand-driven, compared to some export-led Asian economies.
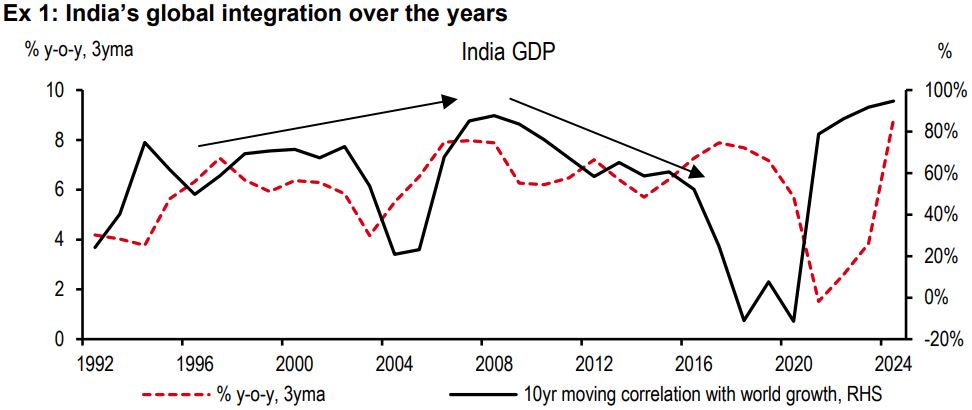
Having said that, we find that India has grown at its fastest pace in periods of rising global integration with the world. After all, a whole new market opens up when a country is open to it.
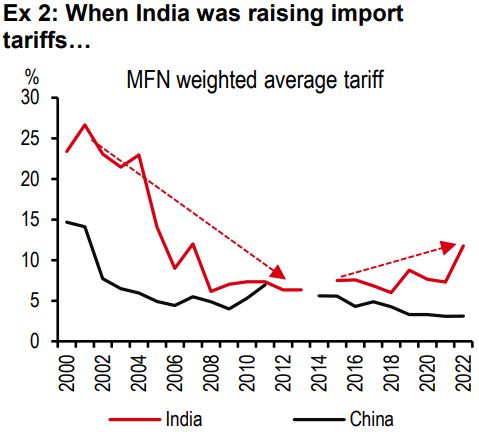
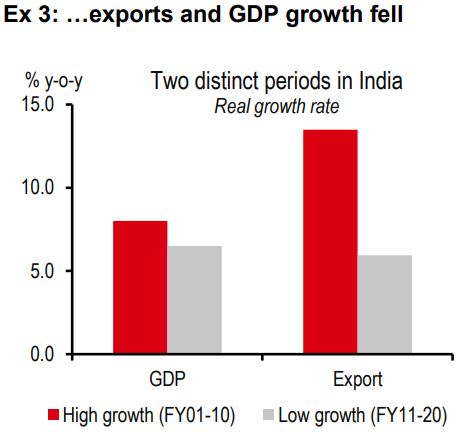
We use the rolling correlation between India and world growth as a measure of global integration in this report, and find that the 2000-2010 decade was particularly striking as a period of rising global integration and strong India GDP growth (c8% per year, see exhibit 1). This is the time India was slashing import tariffs and integrating further into global trade, resulting in higher export growth, global export share and GDP growth.
In the next decade, 2010-2020, India began to raise import tariffs. This period saw a fall in export growth, global export share and GDP growth.
We also note that during the last few years, i.e. those following the pandemic, have seen a rise back up in global integration and GDP growth. As we will discuss later in the report, India is making efforts to integrate more with the global economy. But how large and lasting a growth impact, will depend on continued efforts to integrate.
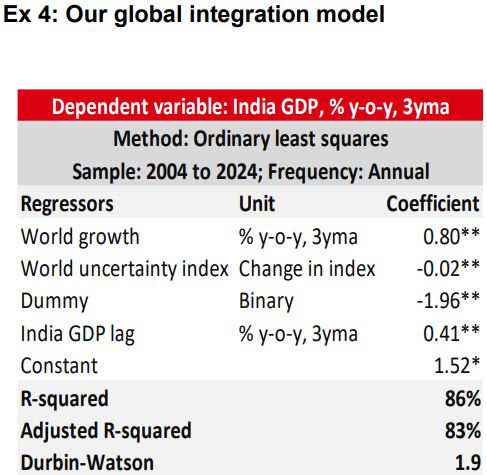
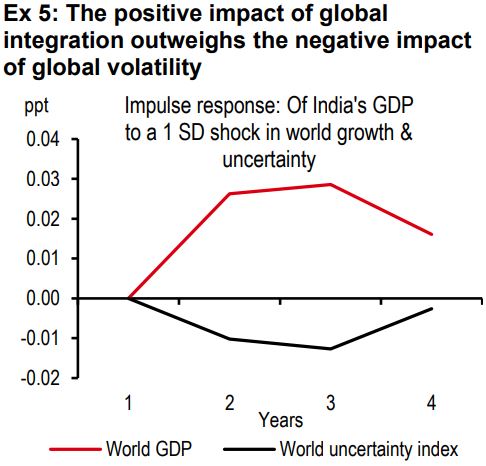
One may argue that higher integration exposes a country to global volatility, which may be negative for growth. We look into this carefully through a VAR regression analysis, and find that the positive impact of being more integrated with the world is higher and longer lasting than the negative impact of being exposed to global volatility (see exhibits 4 and 5).
All said, deeper interlinkages with the world have led to higher growth over time, more than offsetting the negative impact of rise in volatility.
Next, we turn our attention to sectoral flavours, because they shed light on the nature of integration with the world and its impact back home.
We break down GDP on the expenditure side into consumption, investment and exports, and find some interesting, and even surprising, takeaways.
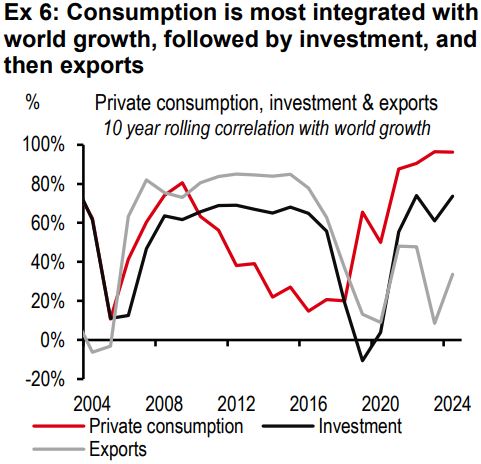
Comparing investment, consumption and export trends. In the pecking order, consumption is most integrated with world growth, followed by investment and then exports (see exhibit 6). This is rather surprising as one might imagine exports to be most correlated with global growth.
As we explore more closely later, one reason could be that India’s linkages with the world arestrong on the financial integration side, which impacts consumption, but more limited on the trade side, which influences exports and thereby, investment.
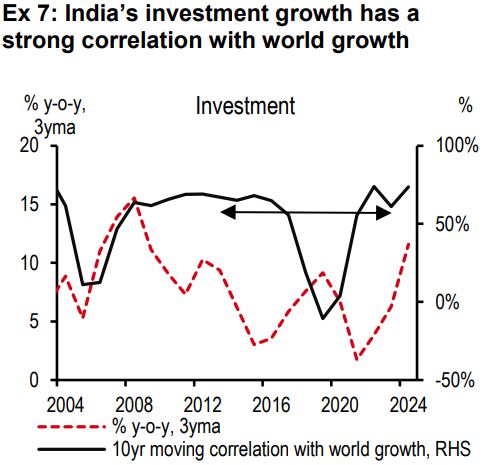
Investment details. India’s investment growth has a strong c70% correlation with world growth (see exhibit 7). We break down investment growth into several parts – public, private corporate and household investment. What stands out is the rather divergent trend in corporate versus household investment.
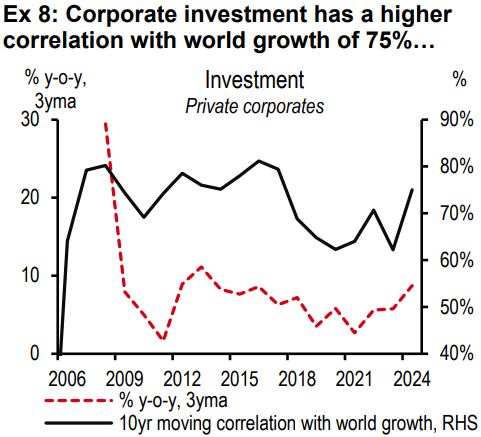
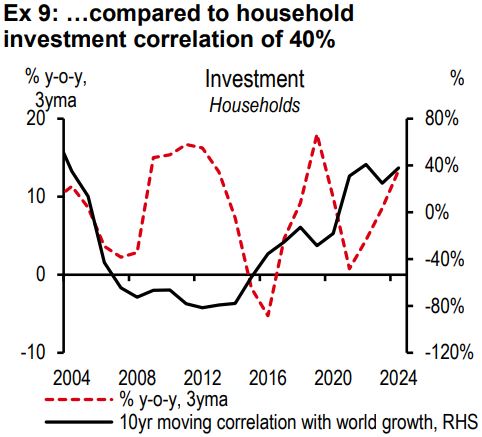
Corporate investment has a higher correlation (of 75%) with world growth compared to household investment (of 40%). The global interlinkages of corporate investment did not really fall in the 2010-2020 period (barring the pandemic years, see exhibit 8).
This is not surprising. We find that corporate capex globally moves in unison, driven by common factors (for instance,risk sentiment impacting FDI flows).
On the other hand, household investment has a smaller correlation (of 40%) with world growth (see exhibit 9). It is importantto note here that household investment in India includes not just real estate and housing, but also investment by small firms.
Consumption. Consumption has an even higher correlation with world growth than investment. It fell in the 2010-2020 period, but has risen since. In fact, the correlation has risen to 100%, which is above previous highs.
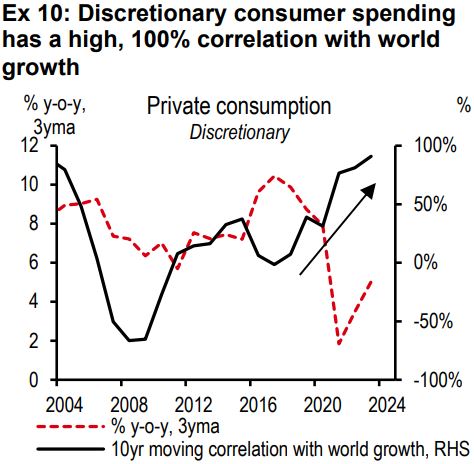
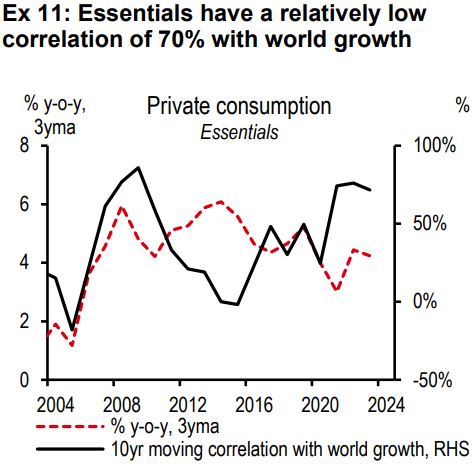
We break down private consumption into two parts – discretionary and essentials (see exhibits 10 and 11)[@india-economics-03-01]. Between these, discretionary consumption has a much higher correlation with world growth (of almost 100%), while essentials have a lower correlation (of 70%).
This is understandable. If indeed financial integration has been strong (as we mention above and explore further later in the report), it is likely to have impacted incomes at the top of the pyramid. High-end consumers, who are typically high income earners, tend to be better integrated with (or invested in) financial markets.
Meanwhile, those associated more with sectors like agriculture and small firms, where incomes may not be as high, are focused on consuming essentials. This consumption group may not have much investible surplus, and therefore not as strongly integrated with financial markets.
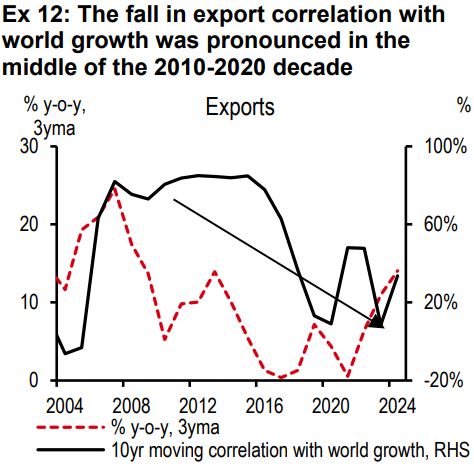
Exports. We probe the surprisingly low correlation of export growth and global growth a bit more. The fall in correlation was pronounced in the middle of the 2010-2020 decade when import tariff rates were being raised and export growth was falling (see exhibit 12).
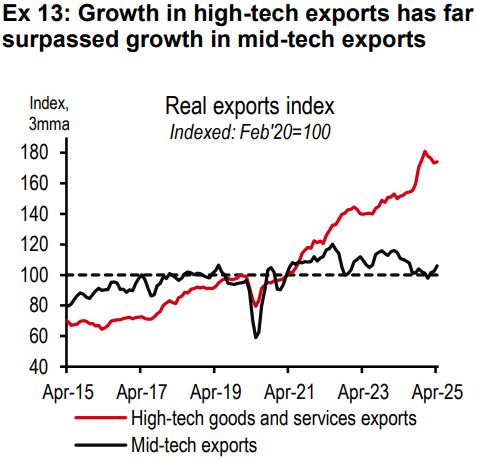
We divide exports into the more capital-intensive high-tech and the more labour-intensive mid-tech exports. We find that growth in high-tech exports has far surpassed growth in mid-tech exports (see exhibit 13). In fact, the latter has been rather sluggish for a decade.
One can thereby deduce that,led mainly by sluggish mid-tech exports, India’s trade integration with the world has been weak.
So now we have two sets of results:
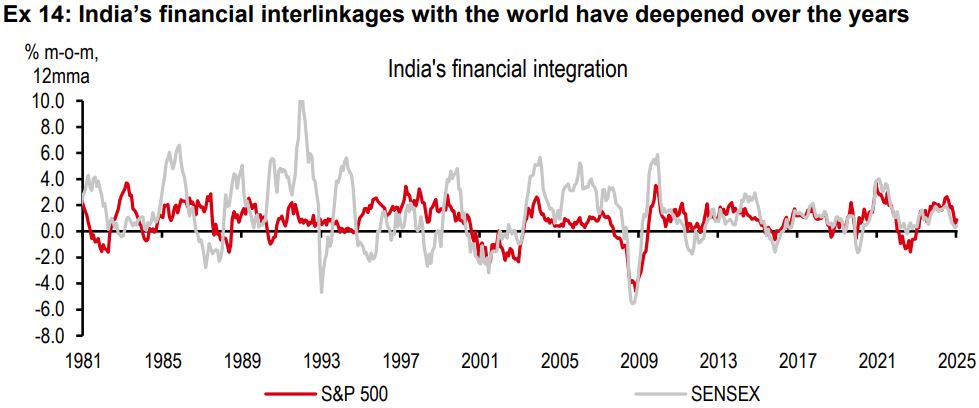
Stronger financial integration. Rising equity market correlation (of the S&P500 and SENSEX indices, see exhibit 14) and the rise in international financial inflows into India show that India has become a lot more financially integrated with the world over time. Those who have been able to enjoy the gains of financial integration have seen incomes and discretionary consumption rise. This even explains the strong correlation between global growth and discretionary consumption.
Many of these individuals could well be associated with large firms in the formal sector, where global capex tends to be highly correlated globally. These individuals could also be associated with high-tech exports, such as India’s rapidly rising professional services exports.
Weaker trade integration. On the other hand, as discussed above, trade integration has been relatively weaker, led particularly by mid-tech exports. About 45% of India’s goods exports come from small firms. Lower global integration here, then, explains lower mid-tech export growth, and lower incomes in this category. Lower incomes go on to explain why this group is focused a lot more on consumption of essentials, and do not have much surplus to trigger investment. This, then, explains why integration of essential consumption and household investment growth with world growth remains low.
A corollary here would be that steps which raise mid-tech exports and India’s trade integration with the world can boost consumption, and particularly investment.
But what needs to go right?
Elevated import tariffs have hurt India’s export potential over the last decade, and mid-tech exports, which are also more labour intensive, have been hurt most. In fact, we believe India was not able to fully seize the opportunities in the first Trump presidency, when supply chains were rejigged following the imposition of new and elevated tariffs[@india-economics-03-02].
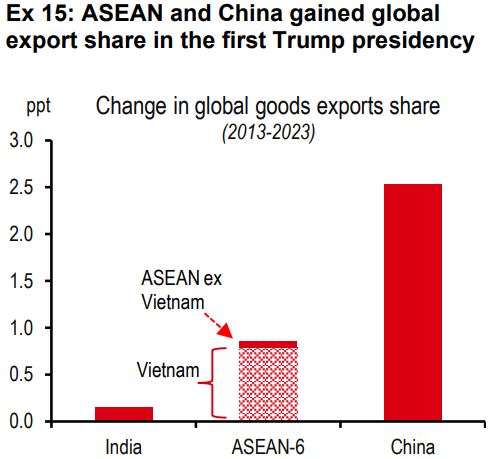
Other blocks like ASEAN made more progress in raising their global export share (see exhibit 15). Vietnam, in particular, made substantial gains in both mid-tech and high-tech sector exports. If supply chains are rejigged again during the second Trump administration, India may have a chance to grow.
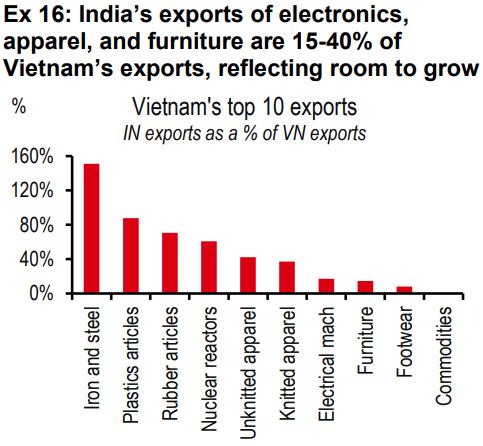
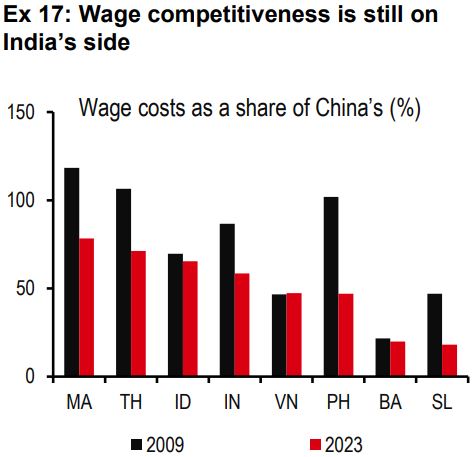
If the sectors where Vietnam made the most progress during the first Trump administration reflect where global opportunities from supply rejigging lie, note that India is already a player in these sectors. India’s exports in sectors like electronics, apparel, furniture, and footwear are 15-40% of Vietnam’s exports (see exhibit 16). This shows that India’s footprint is large enough to show capability, but with room to grow. After all, wage competitiveness is still on India’s side (see exhibit 17).
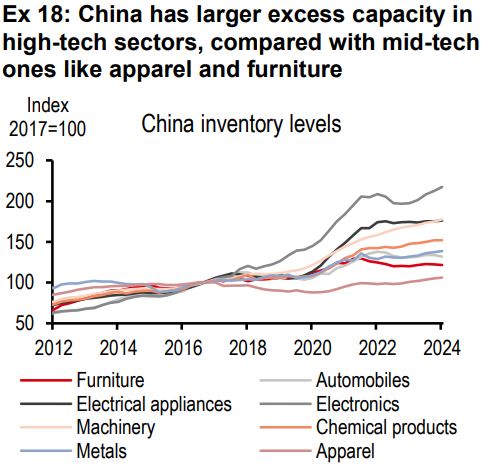
Incidentally, China’s excess capacity is not as large in these mid-tech sectors (see exhibit 18). Space for another manufacturing economy may well be there.
But first,India needs to make changes to do it right this time around.
Potential US tariffs on Indian exports may have become a catalyst for external sector reforms. In fact, India has recently taken a few steps which signal that it is becoming more ‘open for business’:
These are a good start. But for long lasting impact from greater integration with the world, and stronger growth and more jobs, these reforms will have to run deep.


Additional disclosures
1. This report is dated as at 22 May 2025.
2. All market data included in this report are dated as at close 21 May 2025, unless a different date and/or a specific time of day is indicated in the report.
3. HSBC has procedures in place to identify and manage any potential conflicts of interest that arise in connection with its Research business. HSBC's analysts and its other staff who are involved in the preparation and dissemination of Research operate and have a management reporting line independent of HSBC's Investment Banking business. Information Barrier procedures are in place between the Investment Banking, Principal Trading, and Research businesses toensure that any confidential and/or price sensitive information is handled in an appropriate manner.
4. You are not permitted to use, for reference, any data in this document for the purpose of (i) determining the interest payable, or other sums due, under loan agreements or under other financial contracts or instruments, (ii) determining the price at which a financial instrument may be bought or sold or traded or redeemed, or the value of a financial instrument, and/or (iii) measuring the performance of afinancial instrument or of an investment fund.

