
22 Mar 2024
There’s a dominant narrative on the Indian economy. It goes something like this: GDP growth is robust, led by strong public investment, and early signs that the private sector is choosing investment over consumption. In fact, even consumer staples are weak. Strong investment means potential growth has risen, keeping core inflation muted. Sounds convincing, but doesn’t meet the smell test. Historically, investment has never climbed sustainably (+ 10% y-o-y) while consumption is weak (+ 3.8% y-o-y). Shouldn’t higher consumption kick in first, bringing the confidence to invest? In French revolution parlance, is it true that the Indian economy is eating cake while not being able to afford bread?
What’s driving investment? The government is raising capex meaningfully, but PSUs are cutting back, leaving the overall public investment ratio below pre-pandemic levels. Instead, it is private investment that has risen, led by ‘dwellings & structures’. This chimes well with the rise in house sales and housing loan growth. But the other important component of investment –‘machinery & equipment’ – remains weak, and it would be premature to call the start of a new investment cycle, at least at this point.
Is consumption that weak? There are several reasons to believe that consumption growth is not as slow as GDP data suggests. Consumer goods imports, personal services, and non-housing personal loans have been rising quickly. We believe the private consumption data will be revised up in subsequent GDP revisions. While investment growth could still be higher than consumption growth, the wedge between them would likely turn out to be narrower (2ppt instead of 6ppt), implying that overall growth is better balanced between consumption and investment than widely believed.
Having said that, we are not claiming that consumption growth is equitable. Top-of-the-pyramid consumption growth is exceeding bottom-of-the-pyramid, even though data over the last two months suggests that incomes at the lower end have improved.
So why is core inflation falling? It is hard to confirm if potential growth has risen post the pandemic. Instead, the reasons we believe core inflation has fallen are imported disinflation (with China’s export prices tumbling), softer input prices (allowing producers to cut output prices while maintaining margins), and India’s two-speed economy (leaving service inflation depressed). Yet, with scant evidence that financial conditions are tight, we believe the RBI will leave policy rates unchanged for now.
There’s a dominant narrative on the Indian economy. It goes something like this:
GDP growth is strong, led by investment growing 10% y-o -y as per GDP data, and much of this is led by public investment. On the other hand, private consumption is weak, growing at a paltry clip of 3.8% y-o -y[@setting-the-record-straight-01]. Consumer non-durables production is a case in point, only 4% higher than pre-pandemic levels. Households and corporates are choosing investment over consumption, which has raised India’s potential growth, and is also keeping core inflation muted.
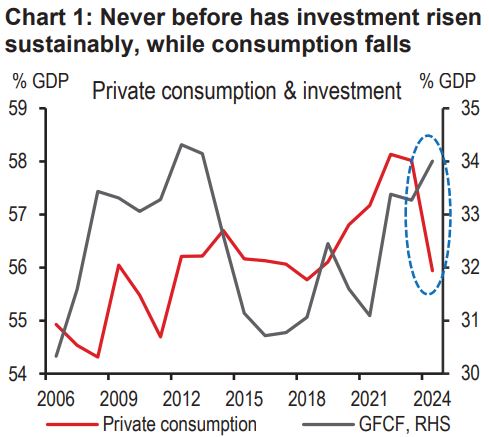
Sounds convincing, but it doesn’t meet the smell test. Historically, investment has never climbed sustainably as a percentage of GDP while consumption falls (see chart 1). After all, it is the same exuberance that drives both. And in the pecking order of growth, higher consumption typically kicks in first, giving confidence to investors, who, over time, add to capacity by investing.
And, the process of investment should lead to the remuneration of either labourers (in the build-out of roads and buildings), or owners of capital, who, in turn, can spend. Sure, one can argue that the marginal propensity to consume is higher for labourers than for owners of capital, but, still, as we document further below, the outperformance of investment over consumption has never been that large.
In French revolution parlance, is it really true that the Indian economy is eating cake while not being able to afford bread?
What’s going on? Let’s dig deeper.
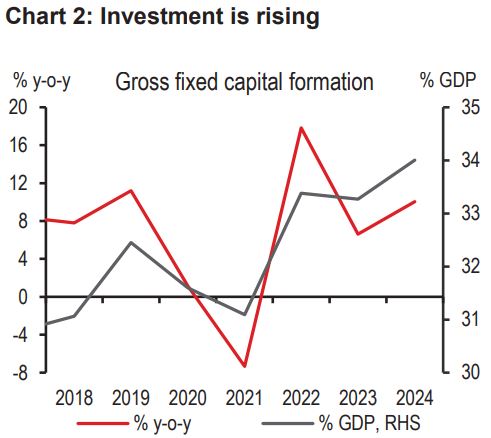
Investment has indeed risen across various cuts of the data (see chart 2). The investment rate is higher than pre-pandemic levels (forecast at 34% of GDP in FY24 versus 32% in FY19), although a touch lower than the peak of FY12 (34.3% of GDP). But what’s the main driver of this spurt?
Exports?
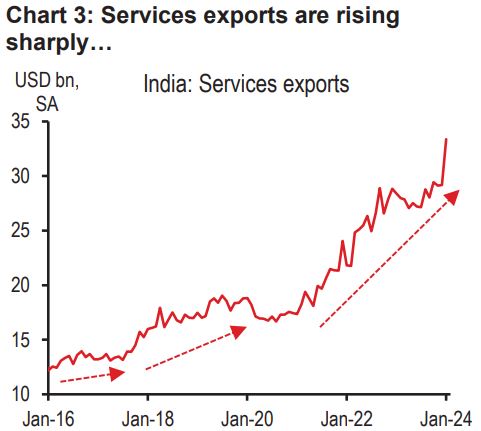
If indeed, consumption demand is weak, what’s stoking investment? Perhaps external demand is strong? And, indeed, India’s export ratio is higher than pre-pandemic levels.
But a closer scrutiny suggests that 85% of the rise is led by higher services exports, rather than higher goods exports[@setting-the-record-straight-02].
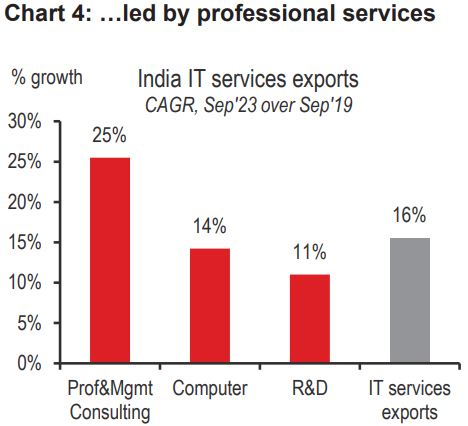
We have written extensively in the past about the dramatic rise in professional services exports, with over 1600 MNCs setting up global capability centres (GCCs) in India, from where they produce and export services ranging from legal, accounting, HR, to business development, R&D and design.
Impressive, indeed. But professional services exports are generally not particularly capital intensive, so can’t really explain the investment rise[@setting-the-record-straight-03]. In fact, if anything, they depend on highly skilled labour (like engineers), whose consumption spending should rise.
Public sector?
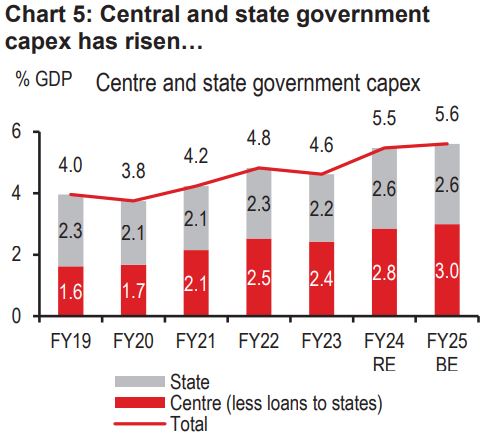
Next, you may suggest that public capex is pushing up India’s investment rate. And, indeed, central government has ramped up capital spending since FY19 (the last pre-pandemic year), and the states joined in the efforts in FY24 (see chart 5). Combined, the two have raised capex by about 2% of GDP over this period.
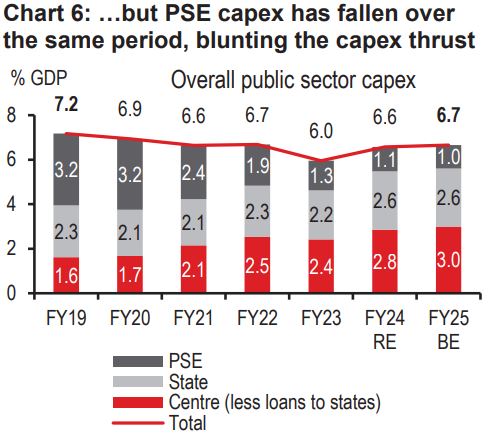
But, alongside, public sector enterprises (PSEs) have lowered their capex thrust over this time, blunting the overall public sector capex push (see chart 6). In fact, overall public sector capex is no higher than pre-pandemic levels.
That then leaves the private sector. Is it really the private players pushing investment higher?
Bottom line: Investment has been growing rapidly. The public investment ratio has risen over the last year, led by higher government capex. But PSUs have cut back sharply, leaving overall investment rates below pre-pandemic levels.
We analyse a detailed breakdown of investment, across private and public corporates, households and general government, which, while the data ends in FY23, gives a good sense of trends, which likely continued into FY24.
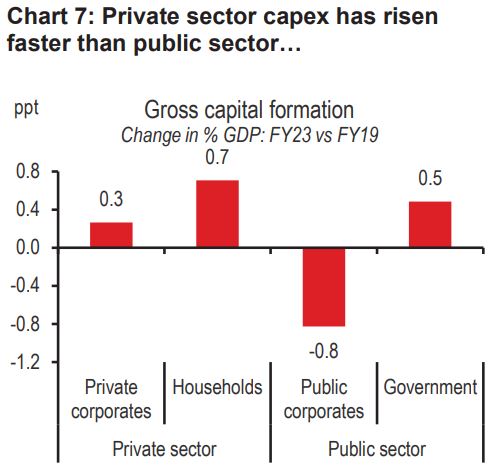
We find that both private corporate and household investment is higher now compared to FY19 (the last pre-pandemic year), and, in fact, the overall private sector capex ramp-up is higher than the overall public sector one (see chart 7).
This leads to the next question. Is this the start of a new private sector led capex cycle, for which we have been waiting for over a decade?
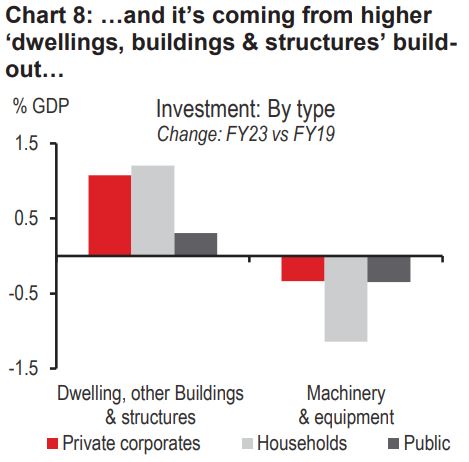
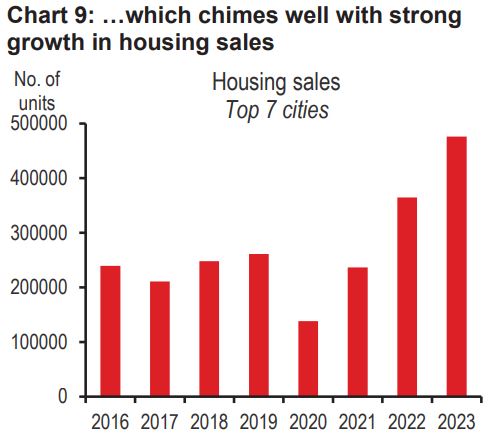
We think not. Or, at least, not yet. Breaking down private capex further shows that, compared to FY19, the entire rise is coming from ‘dwellings,buildings and structures’, which is reflective of real estate and infrastructure (see chart 8). This chimes well with the strong growth we see in house sales (see chart 9) and housing loan growth (+16.7% y-o -y in nominal terms).
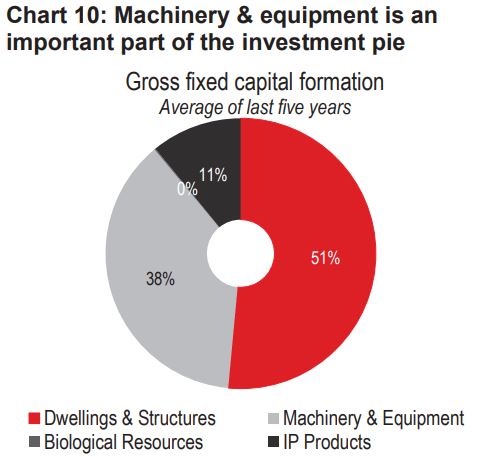
But ‘machinery and equipment’ investment, is not rising. In fact, it is weaker than FY19 levels.
To be sure that this is a new investment cycle, we believe immediate production capacity –reflected by machinery and equipment –should rise. After all, it makes up 40% of India’s investment pie (see pie chart 10).
Bottom line: It is private capex that has prompted the investment spurt, led by ‘dwellings and structures’. This chimes well with the strong growth we see in house sales and housing loan growth. But the other important component of investment –‘machinery and equipment’ – has fallen, and it would be premature to call the start of a new investment cycle, at least at this point.
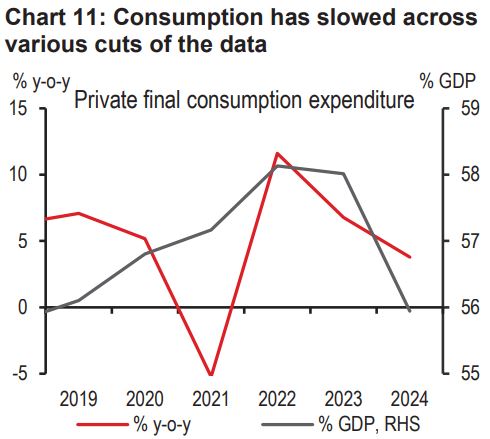
Next, we move to consumption. It has been slowing however we slice the data (see chart 11). The consumption-GDP ratio is lower than pre-pandemic levels (forecast at 55.9% of GDP in FY24 versus 56.1% in FY19). Furthermore, it grew at a paltry 3.5% in the December quarter, less than a third of investment growth.
Can this be true? We have already discussed above that investment and consumption growth do not tend to diverge so sharply. After all, they are driven by the same exuberance/confidence in the economy.
There are several reasons to believe that consumption growth is not as slow as GDP data suggests.
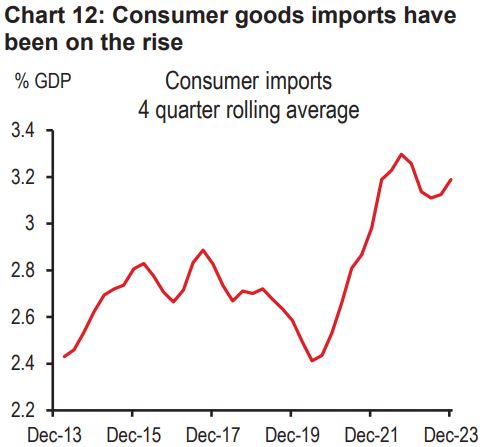
One, real consumer goods imports have been on the rise (see chart 12) and are now 30% higher than pre-pandemic levels. To put this in context, infrastructure and construction goods production is 25% higher than pre-pandemic levels.
Two, the latest GDP data shows that public and personal services grew at 7.5% y-o -y in real terms, December. Of this, public services growth was weak (government consumption declined 3.2% y-o -y), implying that private services demand grew quite rapidly.
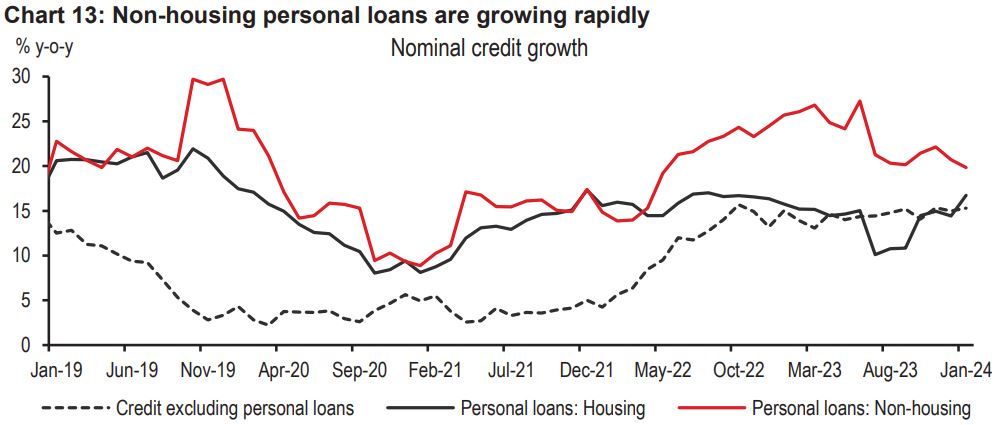
Three, non-housing personal loans, part of which fund consumption, are growing rapidly (+19.8% y-o-y), and even faster than the growth in housing loans (16.7% y-o -y, see chart 13).
Bottom line: We believe GDP data is underestimating private consumption. Consumer imports, personal services and non-mortgage growth have all been rising faster than nominal GDP growth.
In fact, we believe that, in subsequent revisions, consumption growth will be revised up.
Does that mean that GDP growth will be revised up? Not necessarily, as we believe there will be some redistribution, from investment to consumption. Let us explain.
The same GDP investment data is available in two documents from the government. One of them is the GDP data release, which we get every quarter.
The other comes later, and tries to adjust the GDP investment data to ensure that the savings-investment macro identity holds (whereby: saving – investment = current account balance).
For the identity to hold, an adjustment is often made, by introducing an ‘errors and omissions’ entry under investment. For FY23, ‘errors and omissions’ was a large -1% of GDP (INR2.2trn), which we believe implies that, in the GDP data release, investment was overestimated by 1% of GDP.
If this same amount is taken away from investment and parked as private consumption in FY24, investment growth could still be higher than consumption growth, but the wedge between them would be narrower (from investment growth running 6ppt higher than consumption growth, to 2ppt higher than consumption growth), and in line with the long-term average. Overall economic growth would be better balanced between consumption and investment.
Bottom line: We believe private consumption will be revised up in subsequent GDP revisions. While investment growth could still be higher than consumption growth, the wedge between them would likely turn out to be narrower than is reflected in the GDP data currently, implying that overall economic growth is better balanced between consumption and investment than is widely believed.
While we believe consumption growth is not as weak as reflected in GDP data, and expect upward revisions, we are not implying that consumption growth is equitable.
We do believe that top-of-the-pyramid demand is far more robust than bottom-of-the pyramid, as reflected by strong real consumer durable goods imports (30% above pre-pandemic levels) coexisting with weak non-durable goods production (4% above pre-pandemic levels). And with passenger vehicle sales (54% above pre-pandemic levels) outnumbering two-wheeler sales (16% above pre-pandemic levels).
Indeed, rural India has been grappling with climate-change related disruption in rains and food production, and small firms suffered disproportionately more than large firms during the pandemic and commodity prices shock of the past few years.
Having said that, very recent data suggests that things maybe improving for the informal sector:
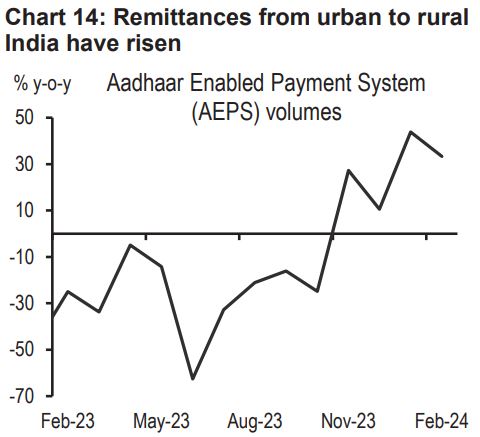
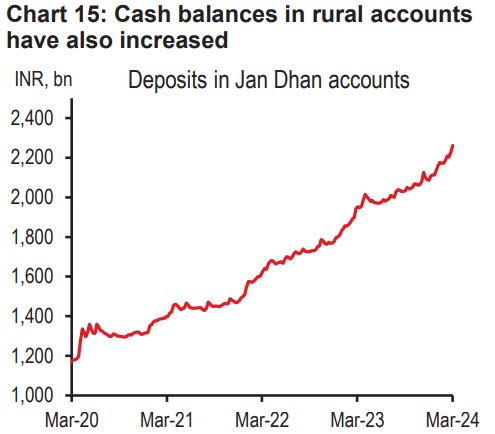
One, some hurt by weak farm production found alternate employment and income in construction work. Indeed, remittances from urban to rural India rose recently, as did cash balances in rural accounts (see charts 14 and 15).
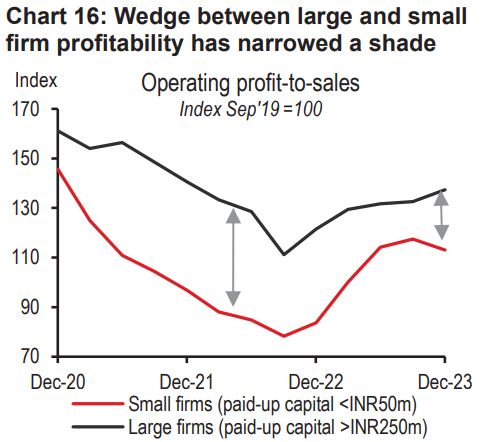
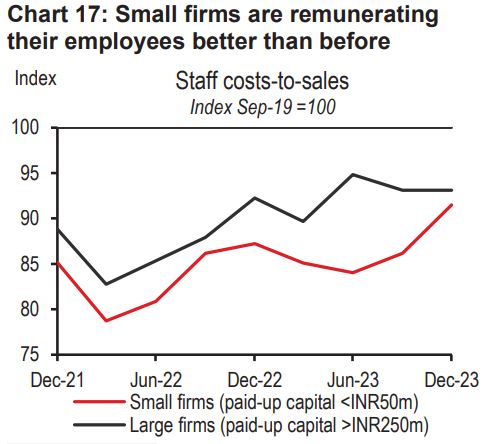
Two, with lockdowns ending and input prices falling, small firms are also regaining business. The wedge between large and small firm profitability has narrowed somewhat (see chart 16). And small firms have been able to remunerate their employees better (see chart 17).
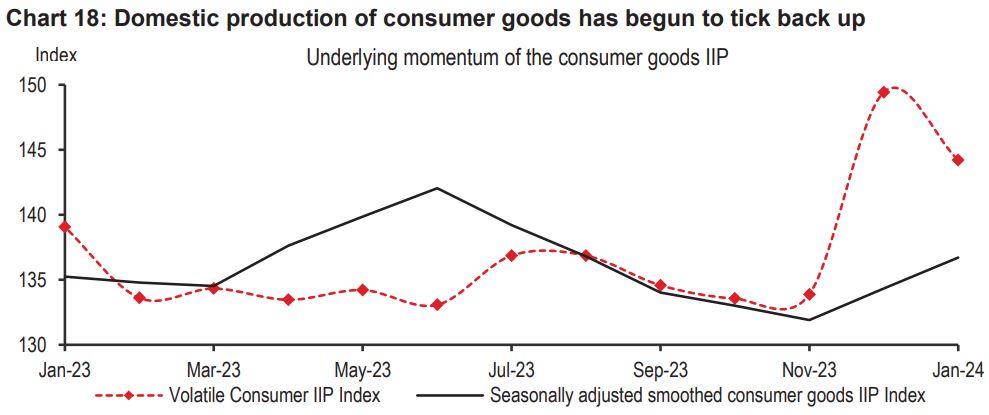
Indeed, we had seen that the domestic production of consumer goods was falling between May and November 2023. Over the last two months, that has begun to tick back up (see chart 18). This may be a trend worth watching.
Bottom line: There are signs of a K-shaped recovery. Having said that, data over the last two months suggests that incomes at the bottom of the pyramid may have improved.
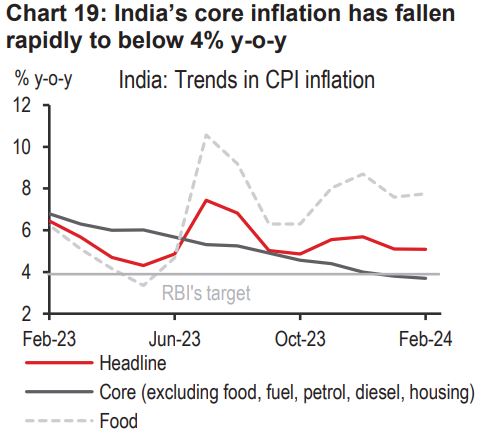
Core inflation has fallen rapidly in India (see chart 19). The dominant narrative puts it down to investment rising, leading to potential growth rising, thereby increasing the slack.
As discussed above, our analysis implies the investment increase is not yet broad based. And potential growth doesn’t need to rise for a slack to emerge. In fact, the latest December quarter data shows that GDP remains 4% below the pre-pandemic trend.
Instead, we believe falling core inflation has to do with the following – two externally determined, and one domestically determined developments:
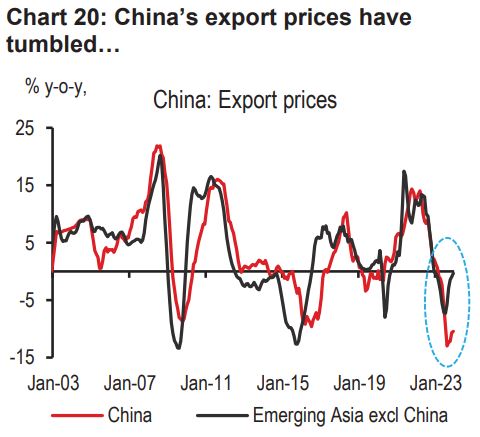
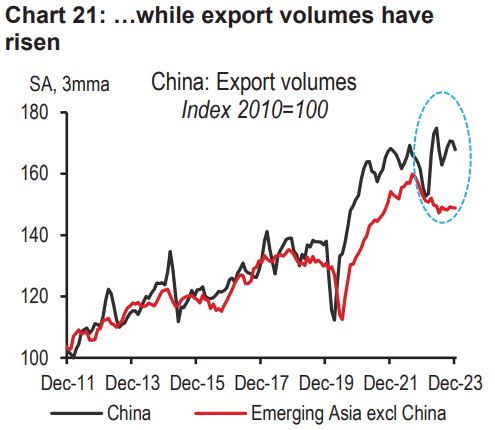
Imported disinflation. Here, it’s worth highlighting the dynamics from China. Wage cost increases in China have been muted, export prices have tumbled, and export volumes have risen. Meanwhile, India’s imports, particularly of consumer goods, have steadily risen. We believe India is importing some of this disinflation.
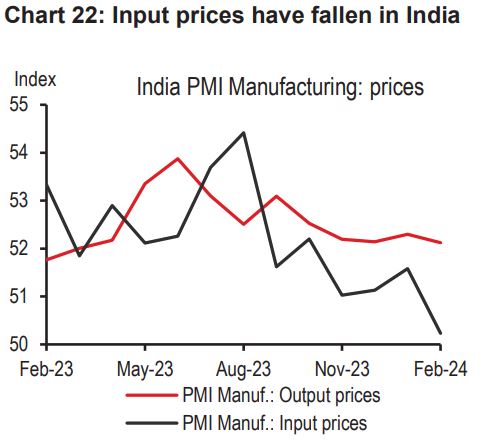
Falling input prices.Oil prices fell 14% y-o-y in FY24. Other commodity prices softened as well. Falling input prices gave manufacturers an opportunity to cut output prices while holding on to profit margins (see chart 22).
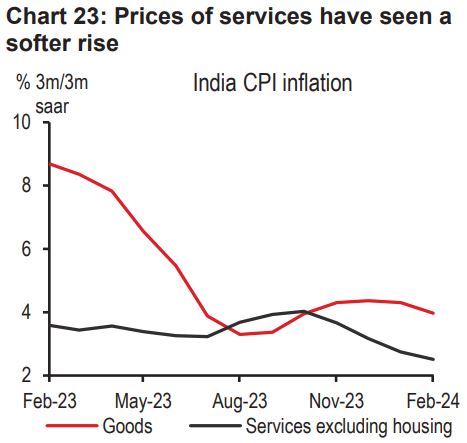
Two-speed economy.As we have discussed at length, ‘new’ India is rising rapidly, while ‘old’ India is growing at a slower pace. This can be seen particularly in the softer rise in the price of services (see chart 23), which the bottom-of-the-pyramid households tend to consume more of, when incomes rise.
Even if input prices rise, and if India’s bottom-of-the-pyramid recovers, we think falling import prices will keep a lid on core inflation over the next several months.
Bottom line: Core inflation has fallen, led by imported disinflation (as China’s export prices tumbled and export volumes soared), softer input prices (allowing producers to cut output prices while maintaining margins), and India’s two-speed economy (service prices will likely rise when household incomes at the bottom-of-the-pyramid increase).
Tight monetary policy has served the central bank well during a period of heightened global volatility. Whether that should change immediately, from a Taylor rule perspective, depends on:
Growth slack... it’s complicated
As discussed above, GDP is 4% below the pre-pandemic trend. As such, it is possible for core inflation to fall (given the slack), and yet for GDP growth prints to be high (as GDP climbs back to the pre-pandemic trend levels). It is worth reiterating that softer core inflation doesn’t necessarily mean higher potential growth.
Things are further complicated as there seems to be a ‘new’ India that is growing more rapidly than ‘old’ India, and it is in the latter where the slack seems to exist. But if trends over the last two months continue, old India could gradually recover, closing the slack.
Neutral rates...it’s not directly observable
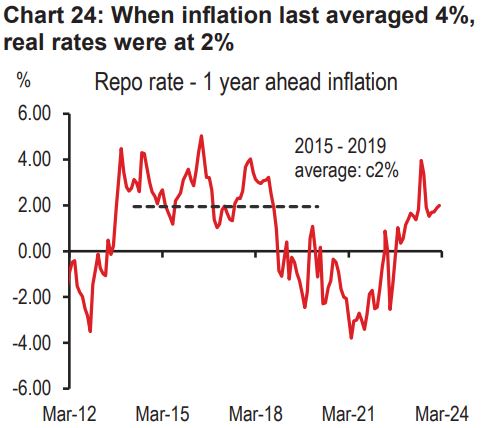
In the period right before the pandemic, headline inflation had averaged 4%. During this period, real rates were around 2% (see chart 24). A RBI study in 2022 indicated that real neutral rates may have halved over the pandemic period, though it is also possible that they have risen since.
While uncertainties on where neutral rates truly lie remain, it is worth noting that real rates at present (at about 2%) do not seem to be restrictive. Credit is growing at 16%, higher thannominal GDP growth of 10%.
And, if indeed potential growth has risen, or is likely to rise, it would mean the economy’s neutral rate levels should only rise.
Inflation...it’s not at target
Core inflation has come down, but headline inflation is still above target (5.1% versus 4% target).Moreover, we believe inflation will move higher in 2H (4.2% in 1H versus 4.8% in 2HFY25).
So, if the growth slack is closing, neutral rates may rise over time, and inflation is not yet at target levels, but growth is buoyant, and oil prices have risen recently, it may be a good idea for the RBI to stay on hold for now.
Already, liquidity has eased somewhat, as reflected in softer overnight rates. And as the government spends at March-end, liquidity could ease further. Against this backdrop, we do not think the RBI will be in a hurry to change its stance[@setting-the-record-straight-04] or cut the repo rate.
We expect a shallow rate cutting cycle (of 50bp starting in June, taking the repo rate to 6% by end-2024), and that to only start once the Fed starts cutting rates.


Additional disclosures
1. This report is dated as at 20 March 2024.
2. All market data included in this report are dated as at close 19 March 2024, unless a different date and/or a specific time of day is indicated in the report.
3. HSBC has procedures in place to identify and manage any potential conflicts of interest that arise in connection with its Research business. HSBC's analysts and its other staff who are involved in the preparation and dissemination of Research operate and have a management reporting line independent of HSBC's Investment Banking business. Information Barrier procedures are in place between the Investment Banking, Principal Trading, and Research businesses toensure that any confidential and/or price sensitive information is handled in an appropriate manner.
4. You are not permitted to use, for reference, any data in this document for the purpose of (i) determining the interest payable, or other sums due, under loan agreements or under other financial contracts or instruments, (ii) determining the price at which a financial instrument may be bought or sold or traded or redeemed, or the value of a financial instrument, and/or (iii) measuring the performance of afinancial instrument or of an investment fund.
This document or video is prepared by The Hongkong and Shanghai Banking Corporation Limited (‘HBAP’), 1 Queen’s Road Central, Hong Kong. HBAP is incorporated in Hong Kong and is part of the HSBC Group. This document or video is distributed and/or made available, HSBC Bank (China) Company Limited, HSBC Bank (Singapore) Limited, HSBC Bank Middle East Limited (UAE), HSBC UK Bank Plc, HSBC Bank Malaysia Berhad (198401015221 (127776-V))/HSBC Amanah Malaysia Berhad (20080100642 1 (807705-X)), HSBC Bank (Taiwan) Limited, HSBC Bank plc, Jersey Branch, HSBC Bank plc, Guernsey Branch, HSBC Bank plc in the Isle of Man, HSBC Continental Europe, Greece, The Hongkong and Shanghai Banking Corporation Limited, India (HSBC India), HSBC Bank (Vietnam) Limited, PT Bank HSBC Indonesia (HBID), HSBC Bank (Uruguay) S.A. (HSBC Uruguay is authorised and oversought by Banco Central del Uruguay), HBAP Sri Lanka Branch, The Hongkong and Shanghai Banking Corporation Limited – Philippine Branch, HSBC Investment and Insurance Brokerage, Philippines Inc, and HSBC FinTech Services (Shanghai) Company Limited and HSBC Mexico, S.A. Multiple Banking Institution HSBC Financial Group (collectively, the “Distributors”) to their respective clients. This document or video is for general circulation and information purposes only.
The contents of this document or video may not be reproduced or further distributed to any person or entity, whether in whole or in part, for any purpose. This document or video must not be distributed in any jurisdiction where its distribution is unlawful. All non-authorised reproduction or use of this document or video will be the responsibility of the user and may lead to legal proceedings. The material contained in this document or video is for general information purposes only and does not constitute investment research or advice or a recommendation to buy or sell investments. Some of the statements contained in this document or video may be considered forward looking statements which provide current expectations or forecasts of future events. Such forward looking statements are not guarantees of future performance or events and involve risks and uncertainties. Actual results may differ materially from those described in such forward-looking statements as a result of various factors. HBAP and the Distributors do not undertake any obligation to update the forward-looking statements contained herein, or to update the reasons why actual results could differ from those projected in the forward-looking statements. This document or video has no contractual value and is not by any means intended as a solicitation, nor a recommendation for the purchase or sale of any financial instrument in any jurisdiction in which such an offer is not lawful. The views and opinions expressed are based on the HSBC Global Investment Committee at the time of preparation and are subject to change at any time. These views may not necessarily indicate HSBC Asset Management‘s current portfolios’ composition. Individual portfolios managed by HSBC Asset Management primarily reflect individual clients’ objectives, risk preferences, time horizon, and market liquidity.
The value of investments and the income from them can go down as well as up and investors may not get back the amount originally invested. Past performance contained in this document or video is not a reliable indicator of future performance whilst any forecasts, projections and simulations contained herein should not be relied upon as an indication of future results. Where overseas investments are held the rate of currency exchange may cause the value of such investments to go down as well as up. Investments in emerging markets are by their nature higher risk and potentially more volatile than those inherent in some established markets. Economies in emerging markets generally are heavily dependent upon international trade and, accordingly, have been and may continue to be affected adversely by trade barriers, exchange controls, managed adjustments in relative currency values and other protectionist measures imposed or negotiated by the countries with which they trade. These economies also have been and may continue to be affected adversely by economic conditions in the countries in which they trade. Investments are subject to market risks, read all investment related documents carefully.
This document or video provides a high-level overview of the recent economic environment and has been prepared for information purposes only. The views presented are those of HBAP and are based on HBAP’s global views and may not necessarily align with the Distributors’ local views. It has not been prepared in accordance with legal requirements designed to promote the independence of investment research and is not subject to any prohibition on dealing ahead of its dissemination. It is not intended to provide and should not be relied on for accounting, legal or tax advice. Before you make any investment decision, you may wish to consult an independent financial adviser. In the event that you choose not to seek advice from a financial adviser, you should carefully consider whether the investment product is suitable for you. You are advised to obtain appropriate professional advice where necessary.
The accuracy and/or completeness of any third-party information obtained from sources which we believe to be reliable might have not been independently verified, hence Customer must seek from several sources prior to making investment decision.
The following statement is only applicable to HSBC Mexico, S.A. Multiple Banking Institution HSBC Financial Group with regard to how the publication is distributed to its customers: This publication is distributed by Wealth Insights of HSBC México, and its objective is for informational purposes only and should not be interpreted as an offer or invitation to buy or sell any security related to financial instruments, investments or other financial product. This communication is not intended to contain an exhaustive description of the considerations that may be important in making a decision to make any change and/or modification to any product, and what is contained or reflected in this report does not constitute, and is not intended to constitute, nor should it be construed as advice, investment advice or a recommendation, offer or solicitation to buy or sell any service, product, security, merchandise, currency or any other asset.
Receiving parties should not consider this document as a substitute for their own judgment. The past performance of the securities or financial instruments mentioned herein is not necessarily indicative of future results. All information, as well as prices indicated, are subject to change without prior notice; Wealth Insights of HSBC Mexico is not obliged to update or keep it current or to give any notification in the event that the information presented here undergoes any update or change. The securities and investment products described herein may not be suitable for sale in all jurisdictions or may not be suitable for some categories of investors.
The information contained in this communication is derived from a variety of sources deemed reliable; however, its accuracy or completeness cannot be guaranteed. HSBC México will not be responsible for any loss or damage of any kind that may arise from transmission errors, inaccuracies, omissions, changes in market factors or conditions, or any other circumstance beyond the control of HSBC. Different HSBC legal entities may carry out distribution of Wealth Insights internationally in accordance with local regulatory requirements.
Important Information about the Hongkong and Shanghai Banking Corporation Limited, India (“HSBC India”)
HSBC India is a branch of The Hongkong and Shanghai Banking Corporation Limited. HSBC India is a distributor of mutual funds and referrer of investment products from third party entities registered and regulated in India. HSBC India does not distribute investment products to those persons who are either the citizens or residents of United States of America (USA), Canada, Australia or New Zealand or any other jurisdiction where such distribution would be contrary to law or regulation.
The following statement is only applicable to HSBC Bank (Taiwan) Limited with regard to how the publication is distributed to its customers: HSBC Bank (Taiwan) Limited (“the Bank”) shall fulfill the fiduciary duty act as a reasonable person once in exercising offering/conducting ordinary care in offering trust services/ business. However, the Bank disclaims any guarantee on the management or operation performance of the trust business.
The following statement is only applicable to PT Bank HSBC Indonesia (“HBID”): PT Bank HSBC Indonesia (“HBID”) is licensed and supervised by Indonesia Financial Services Authority (“OJK”). Customer must understand that historical performance does not guarantee future performance. Investment product that are offered in HBID is third party products, HBID is a selling agent for third party product such as Mutual Fund and Bonds. HBID and HSBC Group (HSBC Holdings Plc and its subsidiaries and associates company or any of its branches) does not guarantee the underlying investment, principal or return on customer investment. Investment in Mutual Funds and Bonds is not covered by the deposit insurance program of the Indonesian Deposit Insurance Corporation (LPS).
Important information on ESG and sustainable investing
In broad terms “ESG and sustainable investing” products include investment approaches or instruments which consider environmental, social, governance and/or other sustainability factors to varying degrees. Certain instruments we classify as sustainable may be in the process of changing to deliver sustainability outcomes. There is no guarantee that ESG and Sustainable investing products will produce returns similar to those which don’t consider these factors. ESG and Sustainable investing products may diverge from traditional market benchmarks. In addition, there is no standard definition of, or measurement criteria for, ESG and Sustainable investing or the impact of ESG and Sustainable investing products. ESG and Sustainable investing and related impact measurement criteria are (a) highly subjective and (b) may vary significantly across and within sectors.
HSBC may rely on measurement criteria devised and reported by third party providers or issuers. HSBC does not always conduct its own specific due diligence in relation to measurement criteria. There is no guarantee: (a) that the nature of the ESG / sustainability impact or measurement criteria of an investment will be aligned with any particular investor’s sustainability goals; or (b) that the stated level or target level of ESG / sustainability impact will be achieved. ESG and Sustainable investing is an evolving area and new regulations are being developed which will affect how investments can be categorised or labelled. An investment which is considered to fulfil sustainable criteria today may not meet those criteria at some point in the future.
THE CONTENTS OF THIS DOCUMENT OR VIDEO HAVE NOT BEEN REVIEWED BY ANY REGULATORY AUTHORITY IN HONG KONG OR ANY OTHER JURISDICTION. YOU ARE ADVISED TO EXERCISE CAUTION IN RELATION TO THE INVESTMENT AND THIS DOCUMENT OR VIDEO. IF YOU ARE IN DOUBT ABOUT ANY OF THE CONTENTS OF THIS DOCUMENT OR VIDEO, YOU SHOULD OBTAIN INDEPENDENT PROFESSIONAL ADVICE.
© Copyright 2024. The Hongkong and Shanghai Banking Corporation Limited, ALL RIGHTS RESERVED.
No part of this document or video may be reproduced, stored in a retrieval system, or transmitted, on any form or by any means, electronic, mechanical, photocopying, recording or otherwise, without the prior written permission of The Hongkong and Shanghai Banking Corporation Limited.

